Introduction
Heikin-Ashi, a term originating from Japanese and translating to "average bar," offers an alternative visual representation compared to the conventional candlestick charts. Fundamentally, Heikin-Ashi utilizes the conventional set of (open, high, low, close) to compute a new set of values (HA-open, HA-high, HA-low, HA-close). As implied by its name, this new HA-OHLC set effectively introduces a degree of smoothing to the initial OHLC data, thereby enhancing traders' ability to perceive market trends with greater clarity. Undoubtedly, a significant portion of profits stems from periods of market trends, underscoring the importance of accurate trend prediction. Therefore, gaining a clear understanding of the fundamental principles behind Heikin-Ashi becomes crucial.
Nevertheless, the calculation method employed in prevalent articles (such as the articles in investopedia) is excessively intricate, making it challenging to grasp the underlying principles. In this article, our aim is to delve into the calculation process of Heikin-Ashi and unravel the intricacies of its formation. Additionally, we will explore potential extensions of this concept to potentially gain a deeper insight into market trends.
Calculation Method
Designating the conventional OHLC data as O, H, L, C, and the Heikin-Ashi OHLC set as HA-O, HA-H, HA-L, HA-C, the relationship between the two can be articulated using the traditional OHLC data as follows:
Here, the notation signifies the preceding bar of the variable. For instance, refers to the prior bar of . Within this set of expressions, the HA-O can be streamlined as follows: In this context, represents an exponential moving average of the variable computed over a period of . The expression implies that the opening price in the Heikin-Ashi method is essentially the result of averaging the past closing prices (3 periods). By using the commutative property of the function , we can further haveIndeed, this expression effectively elucidates the inherent significance of the term "average bar". In order to see the significance of our method more closely, we highlight the traditional ways to use Heikin-Ashi bars (see here):
1. Hollow or green candles with no lower "shadows" indicate a strong uptrend: Let your profits ride!
2. Hollow or green candles signify an uptrend: You might want to add to your long position and exit short positions.
3. Candles with a small body surrounded by upper and lower shadows indicate a trend change: Risk-loving traders might buy or sell here, while others will wait for confirmation before going long or short.
4. Filled or red candles indicate a downtrend: You might want to add to your short position and exit long positions.
5. Filled or red candles with no higher shadows identify a strong downtrend: Stay short until there's a change in trend.
Within the scope of these applications, hollow or green candles are recognized as candles where the Heikin-Ashi opening price (HA-O) is less than the Heikin-Ashi closing price (HA-C). Conversely, filled or red candles are characterized as candles where the Heikin-Ashi opening price (HA-O) surpasses the Heikin-Ashi closing price (HA-C). According to our expression
And here .Creating the Heikin-Ashi formation using the derived approach is uncomplicated when approached from a programming standpoint. To illustrate, we have included a basic PineScript snippet in the TradingView platform at the conclusion of the article. At present, we will emphasize an alternative approach to utilizing HA charts that doesn't involve coding.
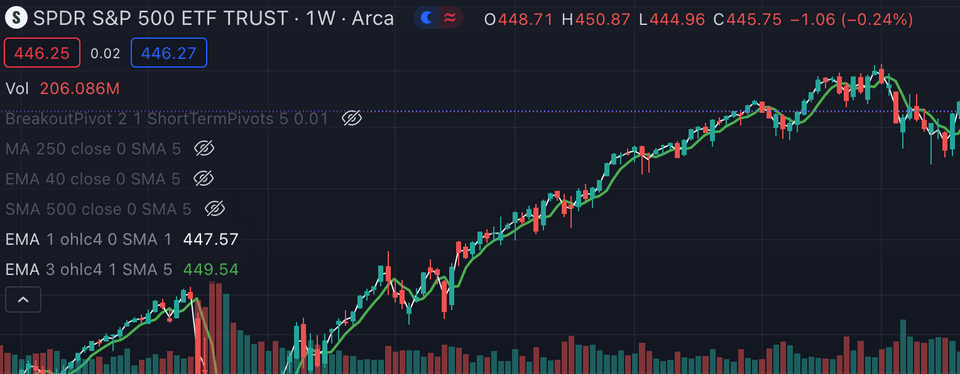
Within TradingView, you have the option to configure two exponential moving average (EMA) curves, each set up as follows:
- curve 1: -- variable , period 1, and offset 0.
- curve 2: -- variable , period 3, and offset 1.
curve 1 is , and curve 2 is . The visualization of these two curves can be depicted in the image below.

In the conventional usage of HA charts, the setup entails the following: if the green curve crosses above the white curve, it signifies a downtrend; conversely, if the white curve crosses below the green curve, it indicates an uptrend.
This method essentially parallels the utilization of moving averages, which is why it's referred to as an "averaged bar."
Generalization
We can broaden the scope of the standard Heikin-Ashi method as follows:
Level 1 HA charts (HA-O, HA-H, HA-L, HA-C):
Level 2 HA charts (, , , ):
Code Snippet
The code is written in Pine Script, a scripting language specific to TradingView. For a comprehensive understanding of Pine Script syntax and grammar, you can refer to TradingView's official website at TradingView.com.
//@version=4study(title="HABar", shorttitle="HABar")// Getting inputsema_period = input(3, title='Period')ha_level = input(1, maxval=3, title='Level')
// ha calculation functionha_function(open_v, high_v, low_v, close_v, length) =>    ha_close = 0.25 * (open_v + high_v + low_v + close_v)    ha_open = ema(ha_close, length)[1]    ha_high = max(high_v, ha_open, ha_close)    ha_low = min(low_v, ha_open, ha_close)    [ha_open, ha_high, ha_low, ha_close]
// level function to select the correct ha levellevel_function(v_1, v_2, v_3, level) =>    if level==1        v_1    else if level==2        v_2    else if level==3        v_3
// calculate three levels of ha candles[ha_open, ha_high, ha_low, ha_close] = ha_function(open, high, low, close, ema_period)[h2a_open, h2a_high, h2a_low, h2a_close] = ha_function(ha_open, ha_high, ha_low, ha_close, ema_period)[h3a_open, h3a_high, h3a_low, h3a_close] = ha_function(h2a_open, h2a_high, h2a_low, h2a_close, ema_period)
// get the final result with the right level_open_ = level_function(ha_open, h2a_open, h3a_open, ha_level)_high_ = level_function(ha_high, h2a_high, h3a_high, ha_level)_low_ = level_function(ha_low, h2a_low, h3a_low, ha_level)_close_ = level_function(ha_close, h2a_close, h3a_close, ha_level)
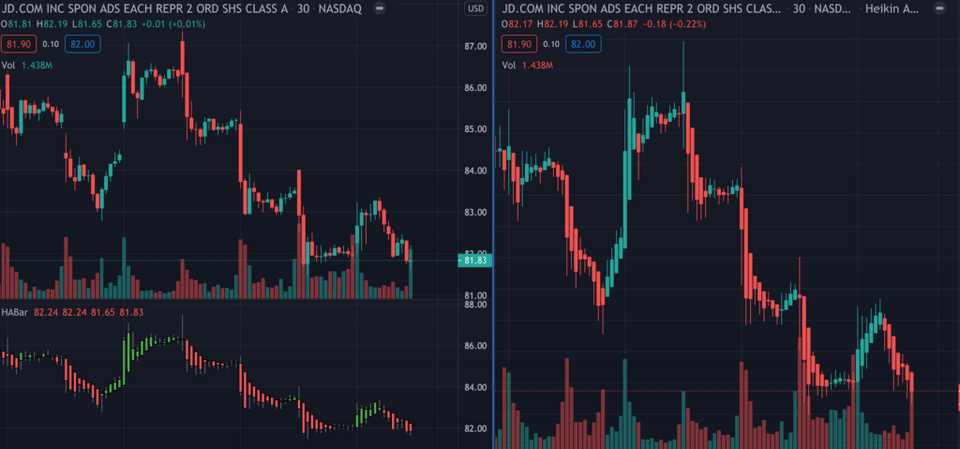
// plot the HA candleplotcandle(_open_, _high_, _low_, _close_, title='HA Bar', color = _open_ <= _close_ ? color.green : color.red)
The functionality of the code is illustrated in the image below:
