Overall, this book is of high quality. This book includes many of the author's failed trades, as well as his reflections on these failures and how he dealt with them. I now realize that, in comparison to successful trades, examples of failed trades are actually more valuable.
Chart trading offered me a unique combination of benefits not available with the other approaches I had attempted or considered, including:
An indication of market direction
A mechanism for timing
A logical point of trade entry
A means to determine risk
A realistic target for taking profits
The determination of a risk/reward relationship
I have been a chart trader ever since. More specifically I trade breakouts of classical chart formations such as head and shoulders tops and bottoms, rectangles, channels, triangles, and the like. I focus on weekly and daily chart patterns that form over a period of four weeks to many months. Even though my focus on charts is longer term, my actual trading tends to be short term, with trades lasting anywhere from a day or two (in the case of losses) to a month or two.
page 6
Indicators are not magic. They provide traders with a clear market direction, entry points, and exit points. It's important to note that the market direction and entry/exit points indicated by indicators are not absolutely correct.
1. Consistently profitable commodity trading is not about discovering some magic way to find profitable trades.
2. Consistently successful trading is founded on solid risk management.
3. Successful trading is a process of doing certain things over and over again with discipline and patience.
4. Recognizing and managing the emotions of fear and greed are central to consistently successful speculation.
5. It is possible to be profitable over time even though the majority of trading events will be losers. “Process” will trump the results of any given trade or series of trades.
6. Charting principles are not magic, but simply provide a structure for a trading process.
page 14
Some sage advice from the author.
A position unit is the number of contracts or size of a position taken per $100,000 and determines the risk assumed on a trade. The risk is normally about six-tenths to eigth-tenths of 1 percent. I refer to a position with less risk as an underleveraged position and positions with more risk as extended-leverage positions.
page 55
The author also says in page 164 that he already reduce the leverage by two-thirds. So if we map everything back then the original risk is 1.8% - 2.4% per 100,000.
600-800 usd per trade risk. (1800-2400 usd per 100,000 in the original plan when the author was young.)
I establish a position at the point of a price breakout and use the low of an upside breakout day or the high of a downside breakout day to set my protective stop levels. This is called the Last Day rule.
There are instances when a very large trading range occurs within a pattern on the day of a breakout. As a result, the Last Day rule may represent a risk far exceeding the idealized four-fifths of 1 percent determined by money management guidelines. In such cases I may elect to use tighter protective stop placement. But rather than simply using some dollar amount I prefer to set a tighter stop using a chart point. This tighter stop point may be determined by the high or low of the last hour spent within a pattern prior to the breakout, or the last 120minutes, 240minutes, or whatever time frame fits the risk and reward parameters I seek for a trade
page 43/44
The steps to setup the initial stop loss.
Often, I attempt to build a position by entering into a trade on multiple dates and at different prices. For example, if I establish a position in anticipation of a future breakout, I consider myself to have established the first layer. If I establish another position at the breakout of a major pattern, I become two layers deep. Perhaps a near-zero-risk opportunity to extend leverage develops at a retest; then I could become three layers deep. Now if I can find a pyramid opportunity, I will end up with a four-layer position. I do not add to a losing position, but put on layers only as earlier layers are profitable. Even in a multiple-layer position, my combined risk in a market rarely exceeds 1 percent.
page 55
Adding positions in extremely good situation
Trailing stop rule (for long):
1. find the highest day of move (since we enter our position). Then the low of the highest day marked as H_l.
2. any day follows the highest day that breaks the H_l is the setup day.
3. When the setup day’s low is be penetrated, then we close our position.
For short:
1. find the lowest day of move. The high of the lowest day marked as L_h.
2. any day follows the lowest day that breaks the L_h is the setup day.
3. When the setup day’s high is be penetrated, then we close our position.
page 69
The steps to setup the trailing stop loss.
It is easy for me to enter a trade, easy to take quick losses on trades that never work, easy to take pyramid trades, and easy to take profits at targets, but enormously difficult to deal with profitable trades that are somewhere between the entry point and the target.
At its most basic level, managing an open trade boils down to a balance between protecting a profit and allowing a trend the opportunity to run its course as implied by a completed chart configuration.
page 107
Both taking a quick loss and taking a quick profit are easy. It is hard for a trader to deal with cases in between.
There are six general conditions I use to exit a trade once it has been established: two with the trade at a loss and four with the trade at a profit.
AT A LOSS:
1. The chart pattern breakout I use to enter the trade is either a failure or a premature breakout. The market reverses and penerates my Last Day Rule stop (or money management stop if used instead of the Last Day Rule for risk managemenet reasons)
2. The breakout fails to provide immediate thrust in the direction of the trade. Within days (perhaps a week or so) the market experiences a hard retest of the pattern, penetrating the boundary line used to enter the trade. If a hard retest occurs, I may elect to adjust my protective stop in relationship to the hard retest.
AT A PROFIT:
1. At the target. I normally take profits at the target indicated by the chart pattern used to initially establish a trade.
2. Successful trades often develop smaller chart patterns during the course of a trend. Depending on the nature and duration of these continuation patterns, I may even pyramid a trend. I will also use the Last Day Rule of a continuation pattern to advance the protective stop on the initial position in the direction of a successful trend.
3. Prior to the attainment of a target, a market may form a pattern with implications counter to the position. In other words, an intervening pattern indicates that a reversal of trend is possible. I may elect to advance my protective stop in relationship to this intervening pattern.
4. At any time during the course of a trend, I may choose to elect the Trailing Stop Rule.
page 123
Some detailed exits for the author.
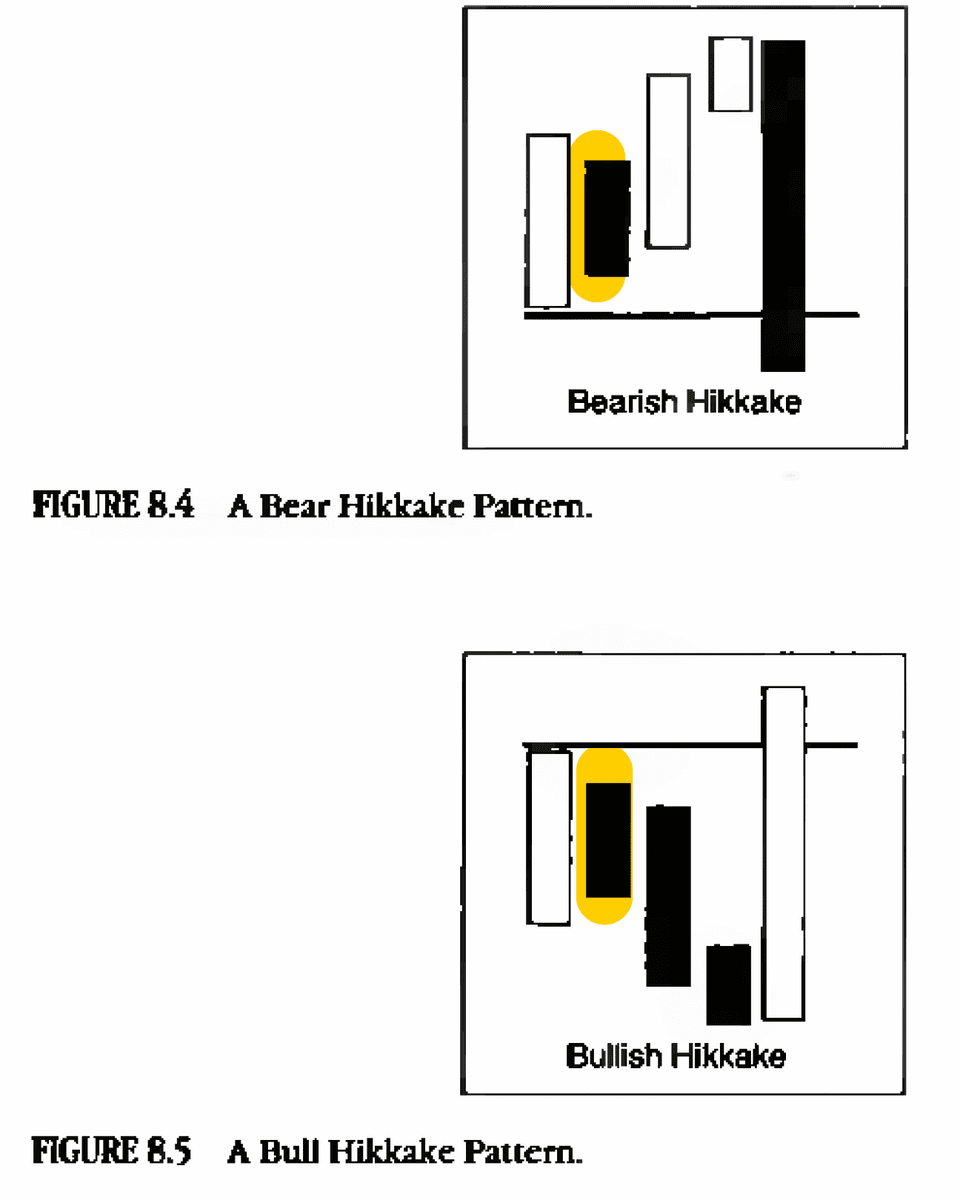
page 151: Hikkaki Pattern

Drawdowns are a way of life for a trader. Periods of capital drawdown bring about tremendous introspection. When trading is going well, it is easy to think trading will never get bad again. When trading goes sour, it is difficult to remember the profitable times.
page 164
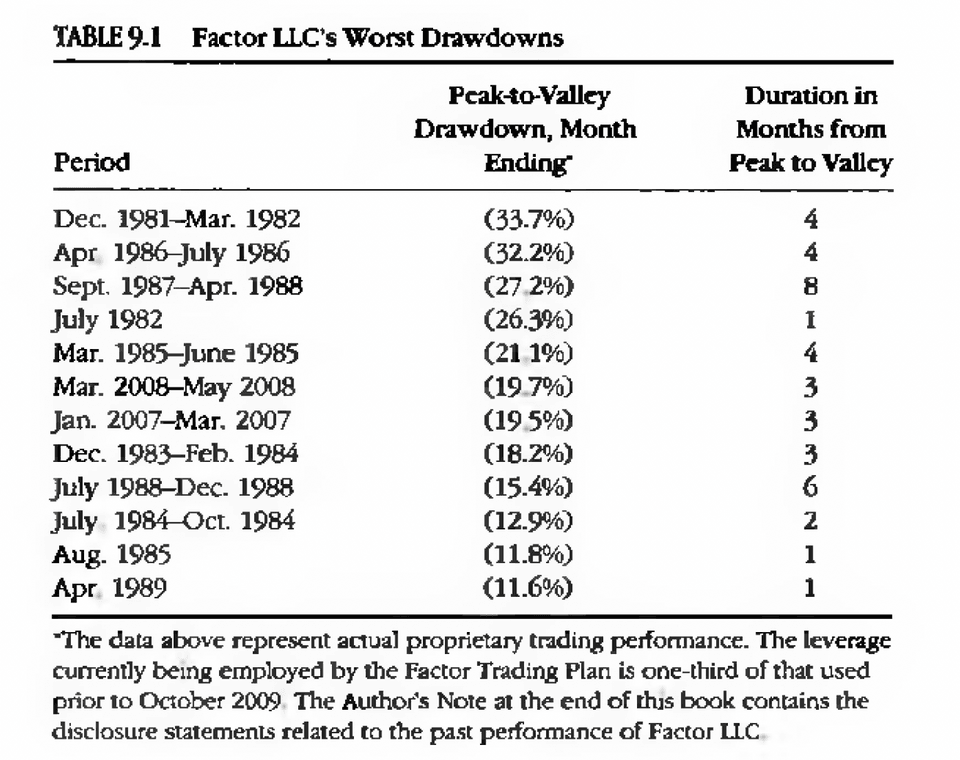
Every career has its own normalcy. As a trader, you cannot be 100% right. You need to learn how to deal with drawdowns.
There are two dimensions to describe a drawdown: how big the drawdown is and how long the drawdown lasts. The following picture displays the Drawdowns the author experienced during his career.
